Figure 2.
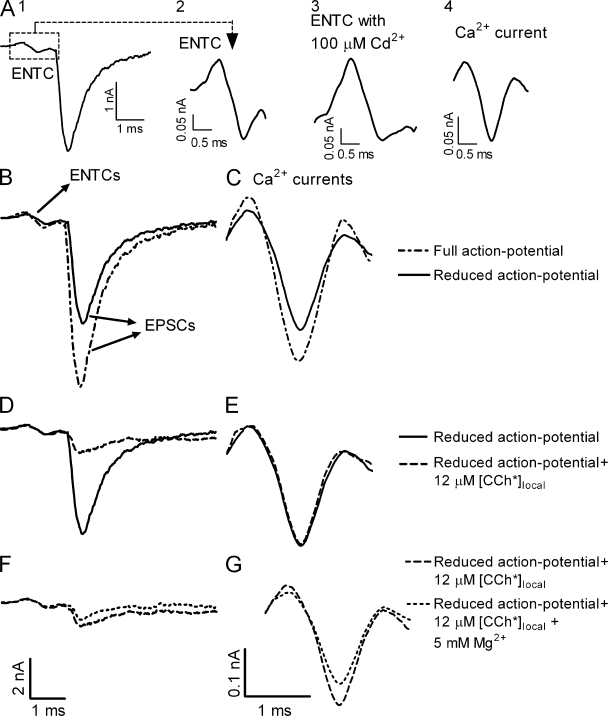
[CCh*]local does not affect Ca2+ currents. (A) Experimental protocol. (A1) The ENTC (dashed square) and the resultant EPSC. (A2) The ENTC on a larger scale. (A3) The ENTC after addition of 100 µM Cd2+. (A4) Net Ca2+ current obtained after subtracting the current seen in A3 from the ENTC. (B–G) Bars in the bottom of each column apply to that entire column. (B and C) Representative example (n = 3) of ENTCs and EPSCs (B) and Ca2+ currents (C) measured with a full action potential (dashed line) and with 50 nM TTX (solid line; i.e., smaller action potential). (D–G) In the presence of 50 nM TTX. (D and E) Representative example (n = 5) of ENTCs and EPSCs (D) and Ca2+ currents (E) measured before (solid line) and 1 ms after (dashed line) the flash ([CCh*]local = 12 µM). [CCh*]local reduced release to 19% of control without affecting Ca2+ currents. (F and G) ENTCs and EPSCs (F) and Ca2+ currents (G) with the same flash in normal [Mg2+]o (1 mM; long dashed line) and with elevated [Mg2+]o (5 mM; short dashed line). Representative example, n = 3.

