Figure 3.
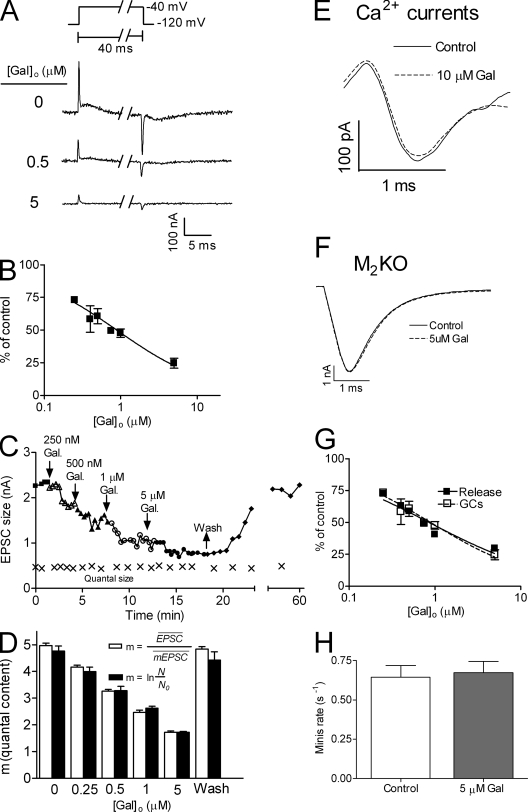
Gal inhibited the GCs and reduced ACh release. (A) Samples of GCs induced by depolarizing the oocyte from −120 mV to −40 mV at different concentrations of Gal. Inset shows the pulse protocol. (B) Normalized DIGCs curves for Gal. In each oocyte, GCs were measured in control and with one concentration of Gal (n = 4–10 for each point taken from 6 donors). IC50-GCs = 0.89 ± 0.05 µM. (C) A representative experiment depicting the dose-dependent effect of Gal on the EPSC size. Washing Gal restored the control values of the EPSC. The quantum size (×), monitored throughout the experiment by measuring the size of asynchronous single quanta released more than 50 ms after depolarization, remained constant. (D) Evaluation of the quantal content (m) from (empty bars), where is the average EPSC and is the average size of a single quantum, and from (full bars), where N is the number of pulses applied and N0 is the number of failures. As seen, the two methods produced similar values of m (n = 6). (E) Ca2+ currents without (solid line) and with (dashed line) 10 µM Gal (representative experiment, n = 3). (F) Superimposed average EPSCs (n = 5) recorded in M2KO mice in control (solid line) and with 5 µM Gal (dashed line). (G) DIrelease curve (■, n = 8) for Gal constructed from experiments such as those in C (IC50-release = 0.85 ± 0.07 µM) compared with the DIGCs curve of Gal (taken from B). (H) Rate of spontaneous release (in WT mice) in control (white), and with 5 µM Gal (gray; n = 5).

