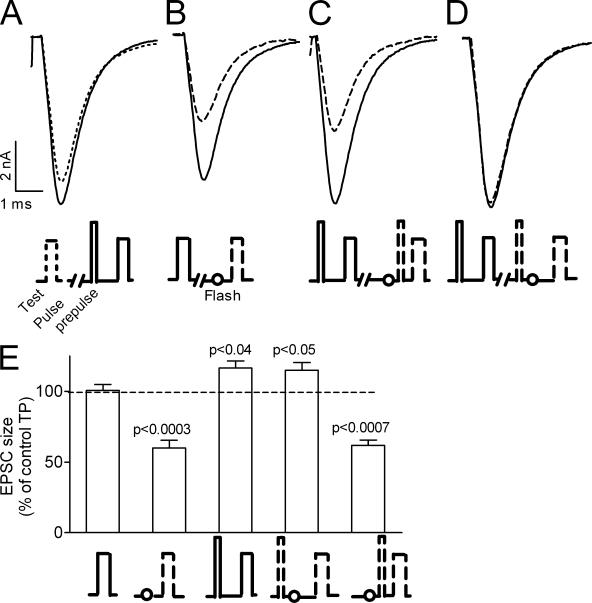
Figure 6.
The effect of the flash is prevented if it is preceded by the very brief (0.1 ms) and strong (−1.0 μA) prepulse. (A–D) Test pulse (−0.6 μA, 0.2 ms) EPSCs under various conditions. Recordings from the same site, each trace is an average of five repetitions. Flash was always applied 1 ms before the test pulse. (A) The test pulse is preceded by 1.2 ms (solid line) or not (dashed line) by the prepulse. (B–D) EPSCs without (solid line) and with (dashed line) a flash. (B) The test pulse alone and preceded by the flash. (C) The flash precedes the prepulse by 0.2 ms. (D) The flash follows the prepulse by 0.2 ms. (E) Average of 14 experiments as in A–D. From left to right, 100 ± 4%, 60 ± 5%, 117 ± 5%, 115 ± 5%, and 62 ± 4% of control.

