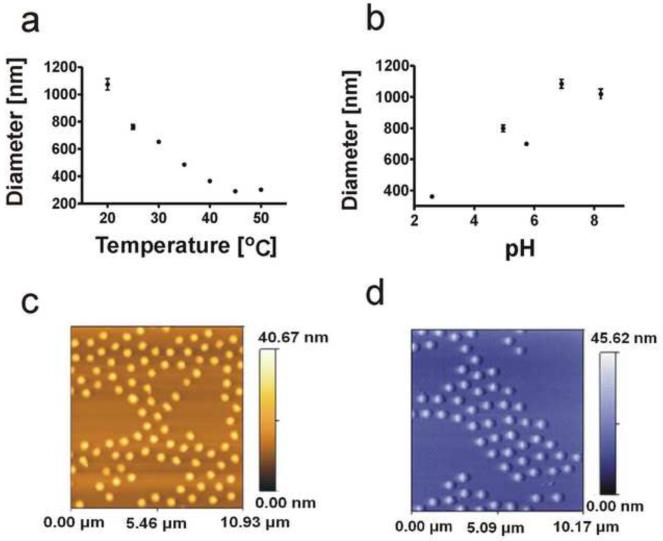
Figure 3.
a. Correlation between temperature and average diameter of microparticles. Standard deviations represented by error bars. b. Correlation between pH and average diameter of microparticles. Standard deviations represented by error bars. c. and d. False color AFM images of the NIPAm-AB48 hydrogel microparticles. Diameter, measured on the AFM image of 20 microparticles, was 606.6 +/− 22 nm.

