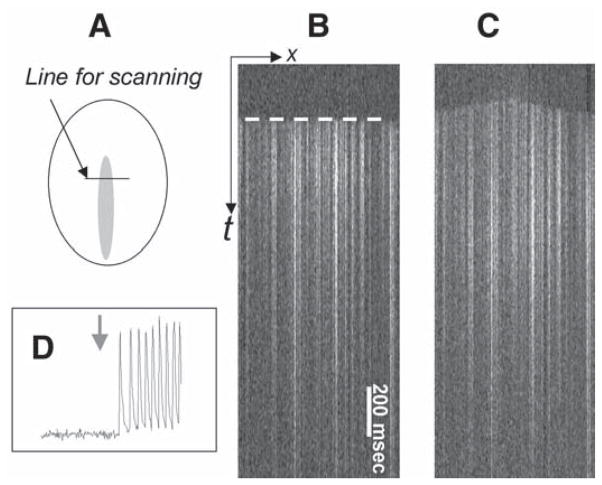
Fig. 6.
Local injury approach as a means to assess dynamic interactions between treated area and the surrounding control network. The experiment was conducted in Fluo-4-loaded myocyte cultures using x-t mode of acquisition. In this mode the fluorescence intensity values are collected along the fixed x-line every 2 ms and the line values are plotted sequentially, forming an x-t image. The front of the calcium transient wave (white dotted line) allows one to determine the direction of the propagating wave. (A) The diagram shows the position of the scanning line across the I-zone. (B) In the control conditions the front of the calcium transient wave is essentially flat (marked by a dotted white line) because paced calcium wave reaches the position of the scan line simultaneously. (C) Presence of 0.1 mM BaCl2 in the I-zone leads to shift of the pacemaker activity to the I-zone. In the line scan mode it can be seen as a change to a dome-shaped front of the calcium transients’ wave with the center in the I-zone. (D) The trace was acquired from the control area, where cells are continuously perfused with the control solution. However, on perfusion of the I-zone with BaCl2 (denoted with a gray arrow), the I-zone cells elicit tachycardia-like response in the entire monolayer, including the control area.

