FIG. 3.

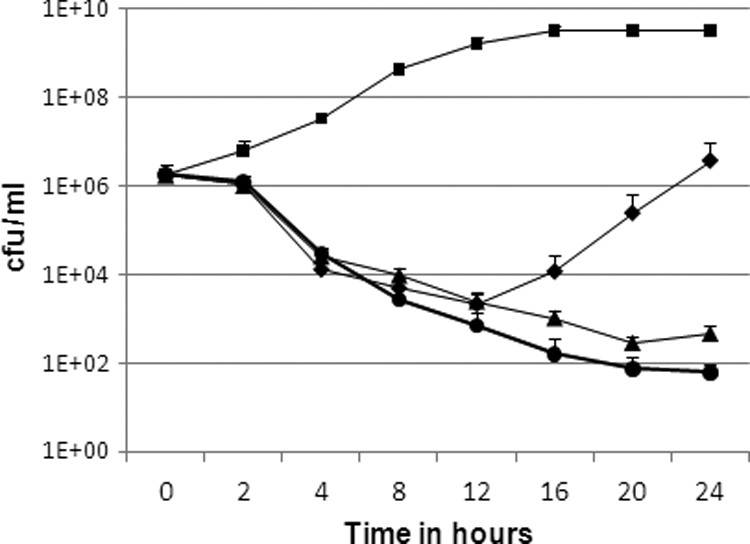
Killing curves of S. aureus HG001 without MT02 (▪), with 1× MIC MT02 (⧫), with 2× MIC MT02 (▴), and with 4× MIC MT02 (•). Mean values from three different experiments are shown. The error bars indicate standard deviations.

Killing curves of S. aureus HG001 without MT02 (▪), with 1× MIC MT02 (⧫), with 2× MIC MT02 (▴), and with 4× MIC MT02 (•). Mean values from three different experiments are shown. The error bars indicate standard deviations.