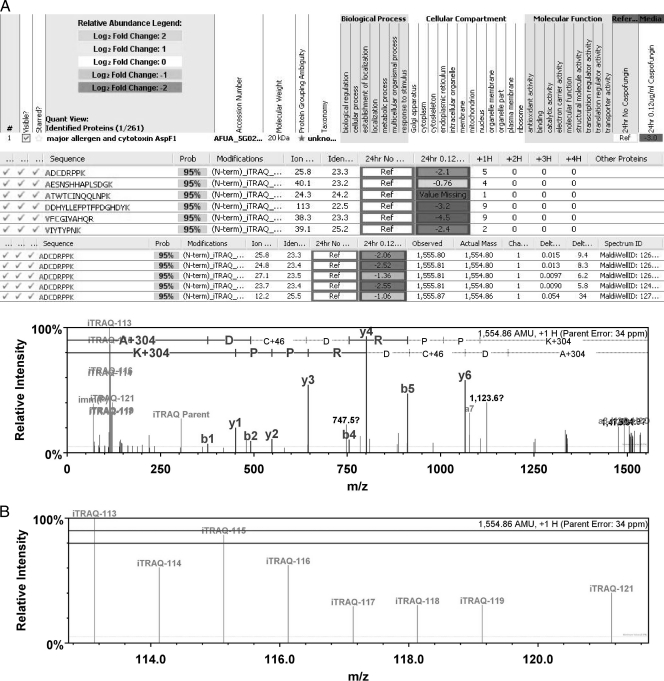
FIG. 4.
iTRAQ results for the major allergen and cytotoxin AspF1. (A) Typical Scaffold software result for iTRAQ showing the identification of proteins and accession numbers. (B) Peptides used to identify specific proteins and fold changes seen for each peptide. The number of times that a singly charged peptide was identified (+1H) is shown. Also, information from each peptide repeat and actual mass spectroscopy data are shown. Also shown is an enlargement of the reporter ion region depicting the level of each reporter ion used to generate the ratio of change for the protein. In this case, the changes seen are between ions 113 (no caspofungin) and 114 (0.12 μg/ml caspofungin) in the media at 24 h.

