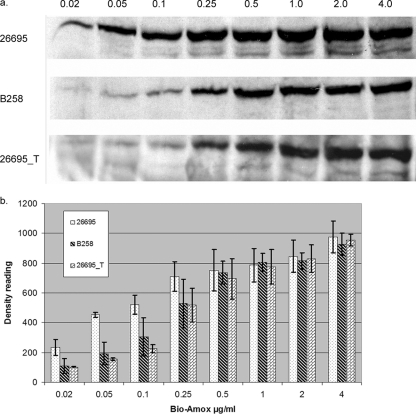
FIG. 3.
(a) Bio-Amox-labeling profiles of PBP1 of H. pylori 26695, B258, and 26695_T. Numbers above the lanes indicate the amount of bio-Amox used in the experiment, in μg/ml. (b) Densitometric comparisons of PBP1 from the 26695, B258, and 26695_T strains labeled with various concentrations of bio-Amox (shown in μg/ml on the x axis). Bars represent the mean results ± standard deviations based on 3 separate experiments.

