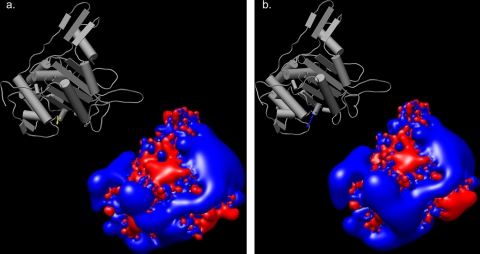
FIG. 4.
Isopotential contour surfaces depicting the spatial distributions of electrostatic potentials of the transpeptidase region of PBP1. Blue and red represent positive and negative electrostatic potentials, respectively, at ±2kBT/e units (kB, Boltzmann constant; T, temperature; e, electron charge). (a) Transpeptidase region of PBP1 from 26695. Inset shows Ser 543 in yellow. (b) Transpeptidase region of PBP1 from B258. Inset shows Arg 543 in blue.

