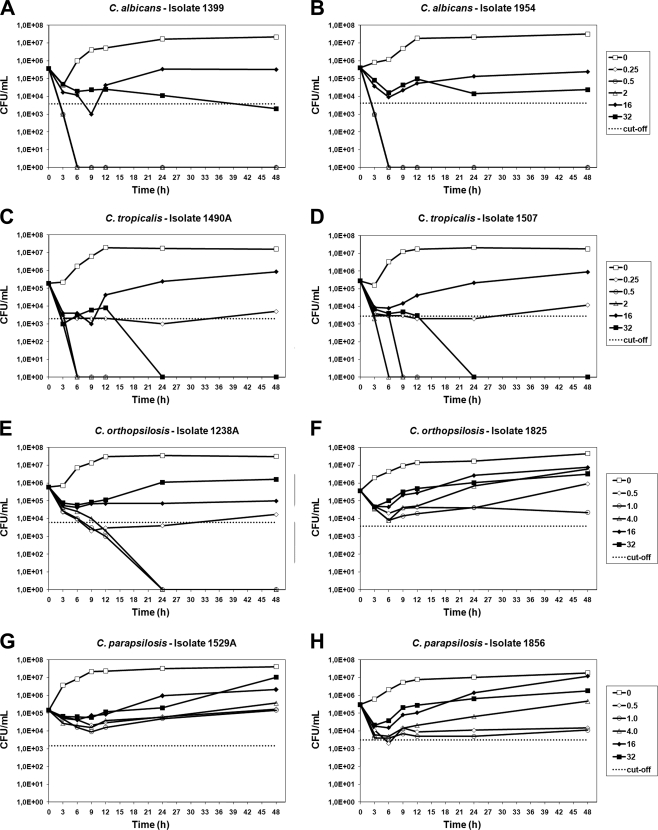
FIG. 1.
Time-kill curves of all tested Candida isolates: C. albicans (A and B), C. tropicalis (C and D), C. orthopsilosis (E and F), and C. parapsilosis (G and H). CAS concentrations used for each species are shown in the respective graphs. The dotted lines represent a >99% growth reduction compared with the initial inoculum sizes (fungicidal activities).

