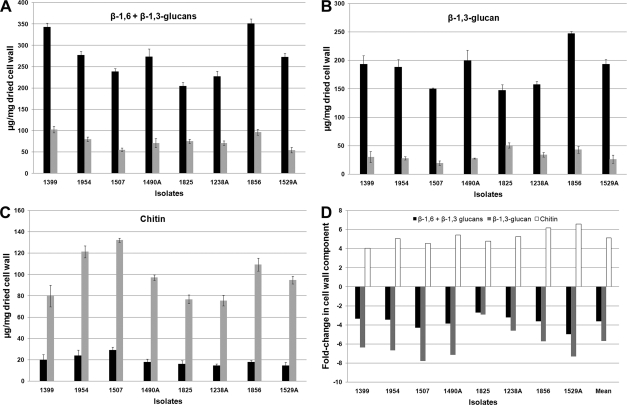
FIG. 2.
Cell wall components of control and PG cells. (A to C) The absolute values of β-1,6- plus β-1,3-glucan (A), β-1,3-glucan (B), and chitin (C) of the control and PG cells (black and gray bars, respectively) were expressed as the number of micrograms of carbohydrate per milligram of dried cell wall. (D) The graph represents the fold change in β-1,6- plus β-1,3-glucan (black), β-1,3-glucan (gray), and chitin (white) contents of PG cells compared to those of control cells.

