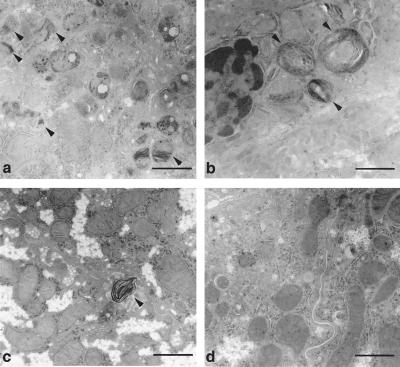
Figure 5.
Electron microscopy analysis of Fabry liver with and without rAAV-AGA treatment. Distinct lipid inclusions (arrows) are seen in hepatocytes (a) and Kupffer cells (b) in the nontransduced Fabry livers. Hepatocytes (c) and Kupffer cells (d) at 5 weeks posttreatment. An occasional inclusion body seen in same representative liver sample (c). [Bar = 1 μm.]

