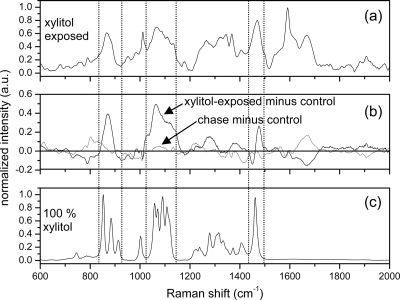
FIG. 2.
Raman spectra of E. coli K-12 and xylitol. (a) Averaged Raman spectrum from xylitol-exposed E. coli K-12. (b) Difference in the xylitol-exposed spectra and the control E. coli K-12 (black) and difference in the postexposure chase spectra and the control E. coli K-12 (gray). Deviations from zero denote changes from the control bacteria and are observed strongly in the spectral regions located between the dashed lines in the xylitol-exposed minus control spectra. (c) Raman spectrum from 100% dried, powdered, and compacted xylitol.

