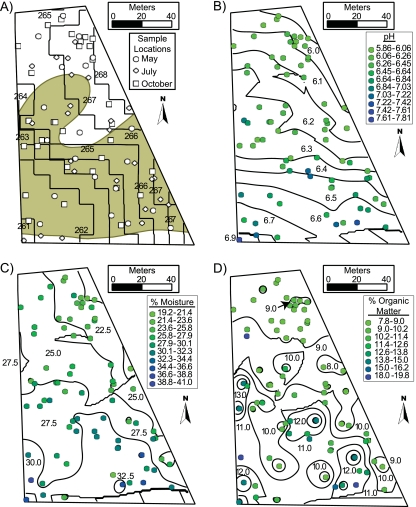
FIG. 1.
Contour plots of soil variables. (A) Contour plot of elevation. Black lines represent elevation contours, and black text indicates the contour values (10-m areal resolution). Points represent soil sample locations in May, July, and October 2008. The Rhinebeck silt loam area is shaded tan, and the Hudson silt loam area is unshaded. (B, C, and D) Contour plots of soil pH, %M, and %OM, respectively. Black contours represent the trend surface output from universal kriging accounting for a gradient in the data mean. Black text indicates the contour values. Colored points represent the measured value for each soil sample.

