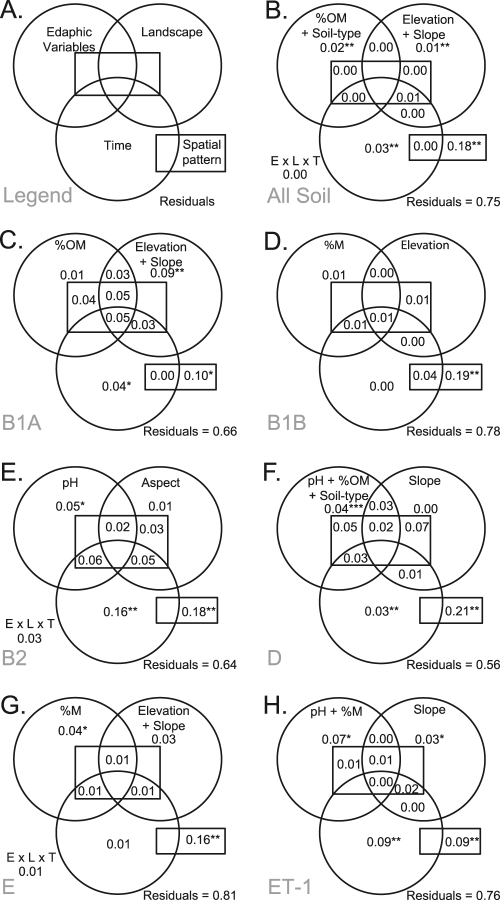
FIG. 3.
Venn diagrams from variance partitioning of subpopulation genetic structures between edaphic, landscape, temporal, and spatial variables. Variables included in partitions are listed in each panel. The central rectangle represents interactions between the three nonspatial variance partitions and the spatial partition. Nonspatial interactions among edaphic, landscape, and temporal variables (E × L × T) are indicated near the lower left corners of diagrams. Proportions of variance explained by each partition are displayed, with the significance of F tests annotated as follows: *, P < 0.05; **, P < 0.01; and ***, P < 0.001. (A) Legend; (B) all soil E. coli isolates; (C) clade B1A; (D) clade B1B; (E) ECOR B2; (F) ECOR D; (G) ECOR E; and (H) clade ET-1.

