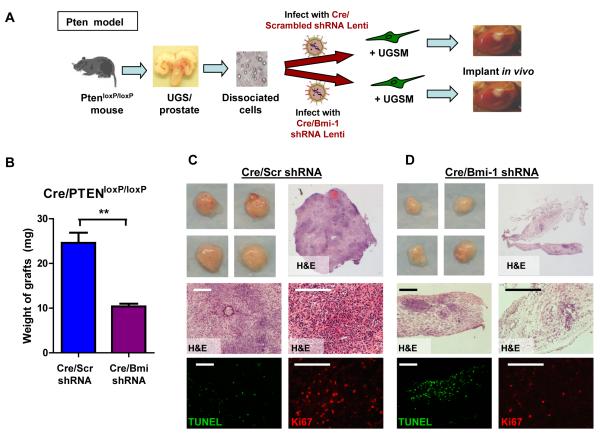
Figure 7. Bmi-1 inhibition attenuates tumor growth from Pten-null prostate cells.
(A) Schematic of experimental approach. (B) Average weight of Cre/scrambled and Cre/Bmi-1 shRNA infected grafts from 6 grafts each and 2 experiments, represented as mean +/− SEM. (C and D) Representative images and H&E sections (top) show the grafts and microscopic phenotypes of regenerated Cre/scrambled (C) and Cre/Bmi-1 shRNA (D) infected tumors. Fluorescent images (bottom) show Ki67 (red) and TUNEL (green) staining of representative sections. Bars=200μm. See also Figure S7B and C.

