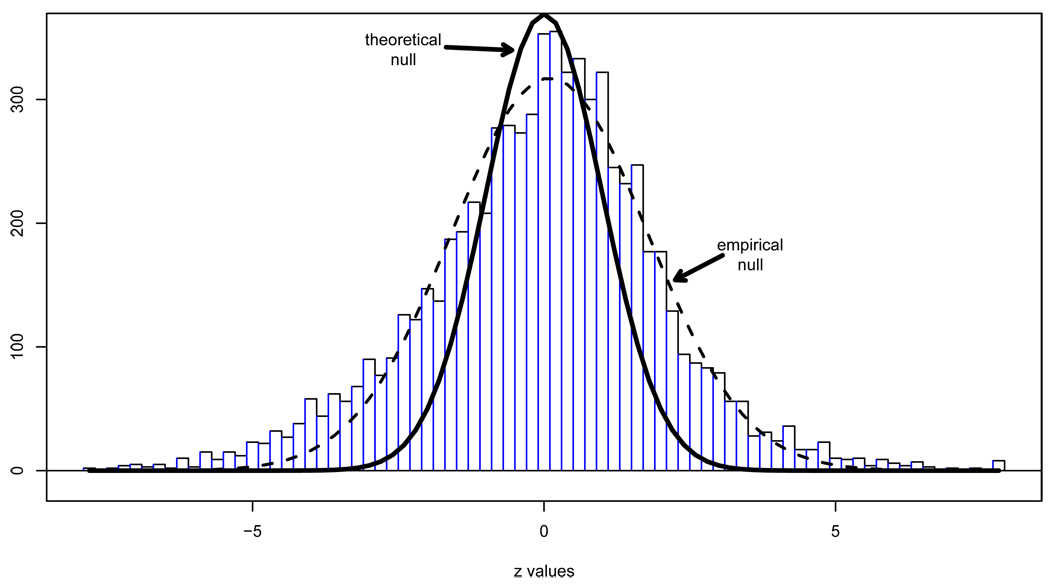
Figure 5.
Histogram of z-values for N = 7128 genes in a microarray study comparing two types of leukemia. The N(0, 1) theoretical null is much narrower than the histogram center; a normal fit to the central histogram height gives empirical null N(.09, 1.682). Both curves have been scaled by their respective estimates of p0 in (7).

