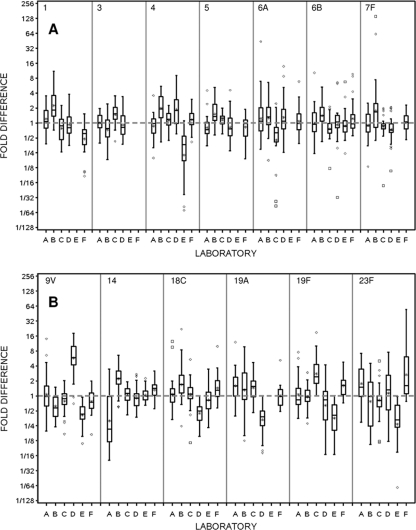
FIG. 3.
Box plots by serotype and laboratory for the fold differences between the consensus and observed OPA titers. Consensus OPA titers were estimated for each sample within a serotype using the random-effects ANOVA model. In these plots, the box is defined by the 25th and 75th percentiles of the distribution; the horizontal line within the box represents the median or 50th percentile, and the asterisk signifies the mean. Vertical lines extend to the most extreme observation that is less than 1.5× the interquartile range (75th to 25th percentiles), and the diamonds and boxes correspond to moderate and severe outlying assay values, respectively.

