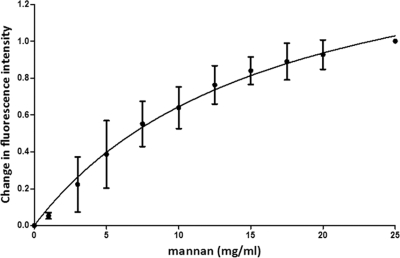
Fig. 6.
Titration curve for N-Flo1p with increasing concentrations of mannan. The circles show the change in fluorescence intensity at each concentration of mannan, ranging from 1 mg/ml to 25 mg/ml. The full line shows the fitting of the data according to the binding model. KD was determined to be 16.53 ± 3.74 mg/ml.

