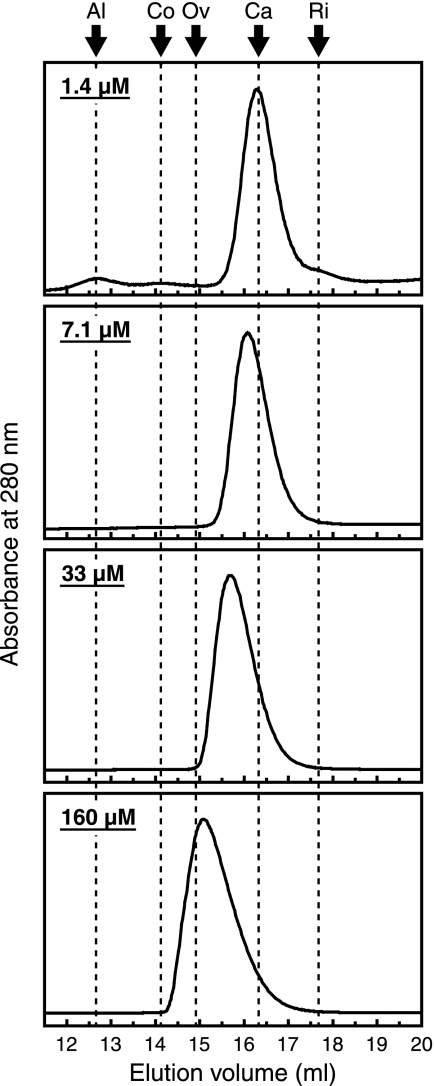
FIG. 3.
Relationship between QscR concentration and its oligomeric state. Gel filtration chromatography was performed with purified QscR loaded at 1.4 μM, 7.1 μM, 33 μM, or 160 μM. The buffer contained 5 μM 3OC12-HSL. The elution of protein was monitored by UV absorption at 280 nm. The arrows indicate peaks of the following standards: aldolase (Al; 158 kDa), conalbumin (Co; 75 kDa), ovalbumin (Ov; 43 kDa), carbonic anhydrase (Ca; 29 kDa), and RNase A (Ri; 13.7 kDa).

