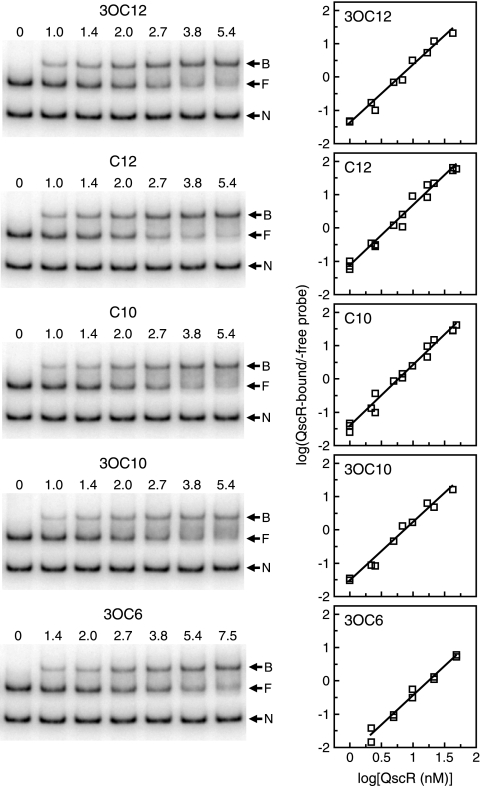
FIG. 5.
Estimation of the binding affinities of different acyl-HSL-bound QscR preparations for target DNA. EMSAs were performed by using QscR purified from 3OC6-HSL-grown E. coli with the following acyl-HSLs added to the DNA binding buffer: 3OC12-, C12-, C10-, and 3OC10-HSLs (5 μM) or 3OC6-HSL (5 mM). Assays were performed two or three times for each acyl-HSL. (Left) A set of representative EMSA results. The numbers above the lanes are the QscR concentrations (in nanomolar concentrations). The positions of nonspecific DNA (N), QscR-free target DNA (F), and QscR-bound DNA (B) are indicated by the arrows to the right of the gels. (Right) Hill plots generated from the EMSA data. Two or three independent data sets are plotted together for each acyl-HSL. The amount of QscR-bound target DNA was calculated as the intensity of the free target DNA band in the control lane (no QscR) minus the intensity of the free DNA band in the presence of the indicated amount of QscR.

