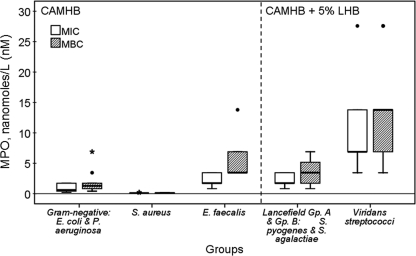
FIG. 4.
The composite results of MPO MIC and MBC testing with the data presented as Tukey box plots. The results are grouped by the medium used, i.e., CAMHB and CAMHB-5% LHB. Five groups of bacteria were tested. As indicated on the x axis, the groups (number of isolates) are as follows: Gram-negative E. coli (n = 6) and P. aeruginosa (n = 6), S. aureus (n = 16), E. faecalis (n = 7), Lancefield group A S. pyogenes (n = 10) and group B S. agalactiae (n = 10), and viridans group streptococci (n = 27). The bottom and top portions (hinges) of each box are the lower and upper quartiles, respectively, and the hinge or H-spread (i.e., the interquartile range) is the distance between the bottom and top of the box. The heavy horizontal band shows the median. The whiskers are the lines drawn from the upper hinge to the upper adjacent value and from the lower hinge to the lower adjacent value within 1.5× the H-spread. An outlier is marked with a circular dot if it is between the inner fences (i.e., 1.5× the H-spread) and outer fence (i.e., 3× the H-spread). An extreme outlier is marked by an asterisk if it is beyond the outer fences.

