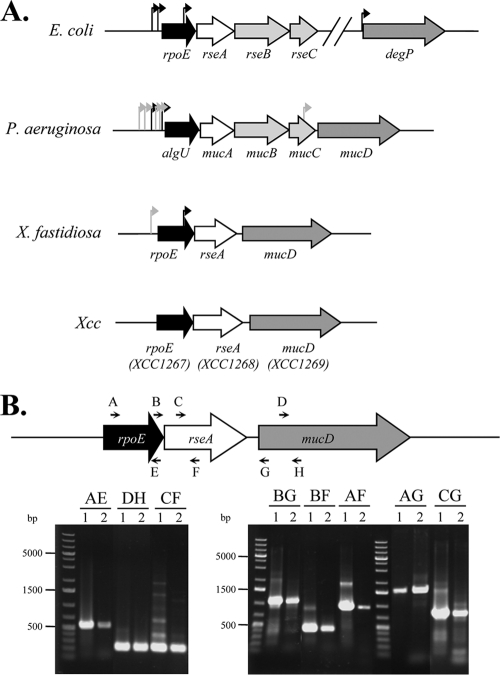
FIG. 1.
Transcriptional organization of the X. campestris pv. campestris rpoE region. (A) Schematic (to scale) showing the organization of the rpoE region in E. coli, P. aeruginosa, X. fastidiosa, and X. campestris pv. campestris. The arrows indicate experimentally demonstrated promoter start sites (black, σE-dependent promoter; gray, σE-independent promoter). (B) Organization of the rpoE region showing the primer pairs used for the amplifications (Table 1 shows primer sequences) and agarose gel of the RT-PCR amplification products. For each primer pair (named according to the letter code of each primer), two lanes are shown (lane 1, positive control using genomic DNA templates; lane 2, RT-PCR using RNA extracted from cells in exponential phase). The molecular size marker is the O'GeneRuler 1-kb Plus DNA Ladder (Fermentas). In each case, the main extension product migrated at the expected size: AE, 524 bp; DF, 228 bp; CF, 235 bp; BG, 1,058 bp; BF, 393 bp; AF, 912 bp; CG, 900 bp; and AG, 1,577 bp.

