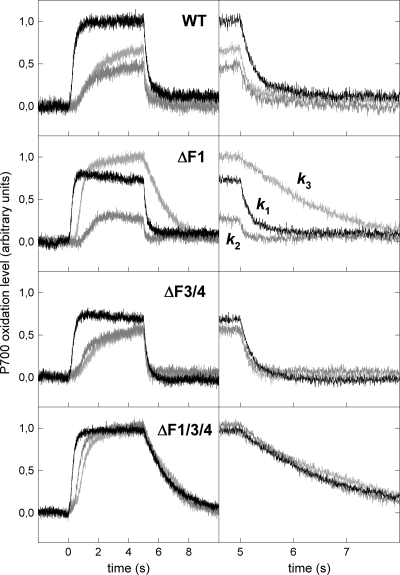
FIG. 2.
Oxidation-reduction kinetics of P700 triggered by FR illumination in WT and ΔF1, ΔF3/F4, and ΔF1/F3/F4 mutants. P700+ rereduction is also shown in a shorter time window (right). Black traces, no addition; dark gray traces, 1 mM KCN; light gray traces, 1 mM KCN plus 100 μM MV. k1, k2, and k3 are the corresponding rate constants of P700+ rereduction, respectively. The levels of 0.0 and 1.0 on the y axis correspond to completely reduced and oxidized P700 populations, respectively.

