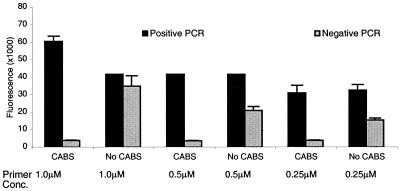
Figure 2.
Effect of 0.2 M CABS (pH 12.7) on the background fluorescence. The black columns represent specific PCR product and the shaded columns represent no specific product. Conditions are as described in Methods. The oligonucleotides used were sense 68 (5′-GTTTCTTGGAGTACTCTACGT-3′ and antisense 104 (5′-CCCGCCTGTCTTCCAGGAA-3′) (15). The height of the column is the average of five readings, and the bar extension is the magnitude of the standard deviation.

