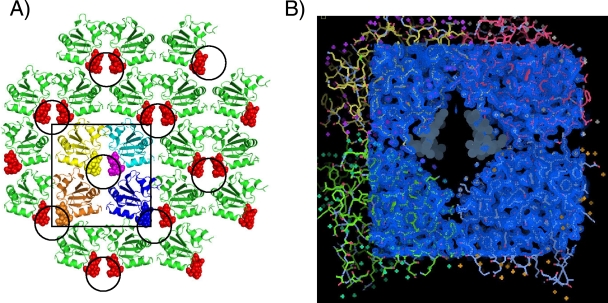
FIG. 2.
The crystal structure of the SV40 T-Ag OBD grown in the presence of poly(dT)12 substrate. (A) View of the crystallographic lattice. The arrangement of T-Ag OBD molecules in the lattice is shown as ribbon diagrams, and the poorly modeled A1 motif residues are shown as spheres. The disordered A1 residues occur within a solvent channel that is made up of four T-Ag OBD molecules, highlighted by the square, and the four T-Ag OBDs are shown in yellow, cyan, brown, and blue. The circles indicate the location of the solvent channels in the crystal structure. This arrangement positions two A1 motifs inside the channel; the other two participate in neighboring channels. (B) Electron density map of the T-Ag OBD crystallographic tetramer. This view shows a 2Fo-Fc (observed and calculated structure factor amplitudes, respectively) electron density map (blue) covering four T-Ag OBD molecules, shown in cyan, green, yellow, and red. The position of the disordered A1 residues are shown as gray dot surfaces and occur within a positively charged solvent channel.

