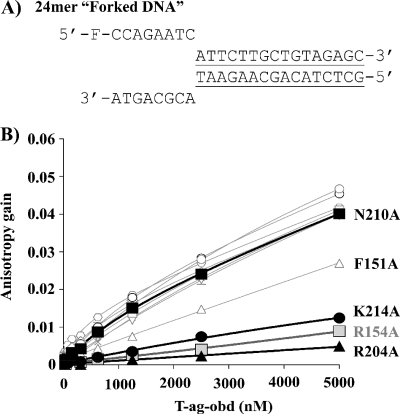
FIG. 5.
Binding of T-Ag OBD proteins to forked DNA measured by fluorescence anisotropy. (A) Nucleotide sequence of the forked DNA probe used in this study. The double-stranded region is underlined. (B) Measurement of the T-Ag OBD-forked DNA interaction via fluorescent anisotropy. Binding isotherms were measured in triplicate with 15 nM probe and increasing concentrations of the wild-type T-Ag OBD (○) or of the V150A (□), F151A (▵), S152A (▿), R154A (gray square), L156A (+), T199A (⋄), H201A (*), H203A (×), R204A (▴), N210A (▪), or K214A (•) mutant protein. Curves were obtained by a nonlinear regression and fitting to a one-binding-site equilibrium. Error bars are not visible on the graph as they are smaller than the size of the symbols.

