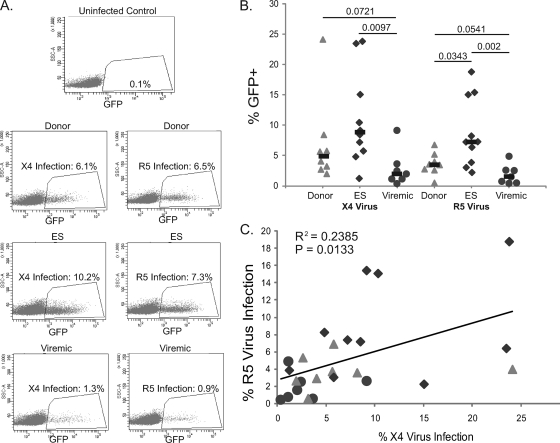
FIG. 2.
Infection of freshly isolated CD4+ T cells with X4 and R5 pseudotyped viruses. (A) Representative infection data for uninfected donors, ES, and viremic patients. (B) Percent infection of CD3+ CD4+ T cells as measured by GFP expression. The percentage of GFP+ CD3+ cells was normalized to the percentage of CD4+ CD3+ cells in the uninfected controls for each patient. P values were derived from the Wilcoxon-Mann-Whitney rank-sum test. The median is indicated by a black bar. (C) Correlation between the percentage of cells infected with R5 virus and the percentage of cells infected with X4 virus.

