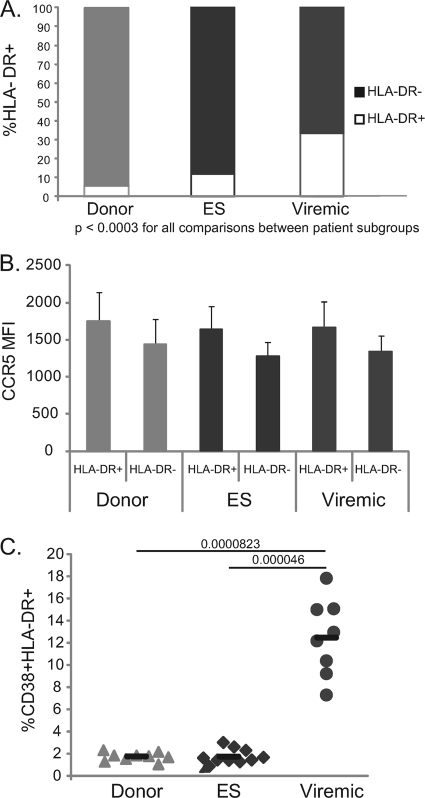
FIG. 6.
CCR5 expression and HLA-DR expression on PBMCs from patient subgroups. (A) Average frequencies of HLA-DR-positive and HLA-DR-negative CD3+ CD4+ cells from each patient subgroup. (B) Average MFI of CCR5 expression on CCR5+ cells. Gating is on CD3+ CD4+ lymphocytes and then on HLA-DR+ and HLA-DR− cells for each patient subgroup. (C) Percentage of CD3+ CD4+ T cells that express both CD38 and HLA-DR. The median percentage is indicated by a black bar. P values were derived from the Wilcoxon-Mann-Whitney rank-sum test.

