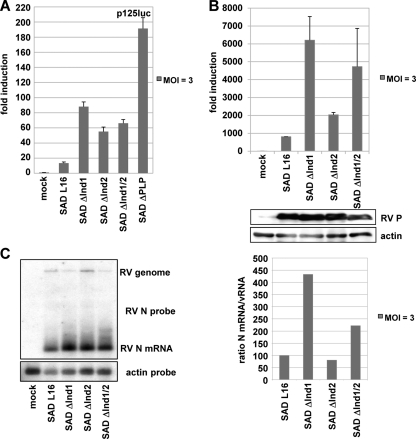
FIG. 4.
(A and B) IFN induction in 293T cells after infection with mutant RV (MOI of 3). (A) Dual-luciferase assay from cells infected for 24 h. (B) qRT-PCR for IFN-β mRNA at 24 h p.i. Infection and P expression were controlled by Western blot analysis. (C) Transcription analysis of recombinant viruses. BSR-T7/5 cells were infected with the indicated viruses at an MOI of 3. RNA was harvested 24 h postinfection and analyzed by Northern blot hybridization with an N probe. The ratio between N gene mRNA and the genome RNA was calculated using ImageQuant and presented as the percentage of the wt SAD L16 ratio.

