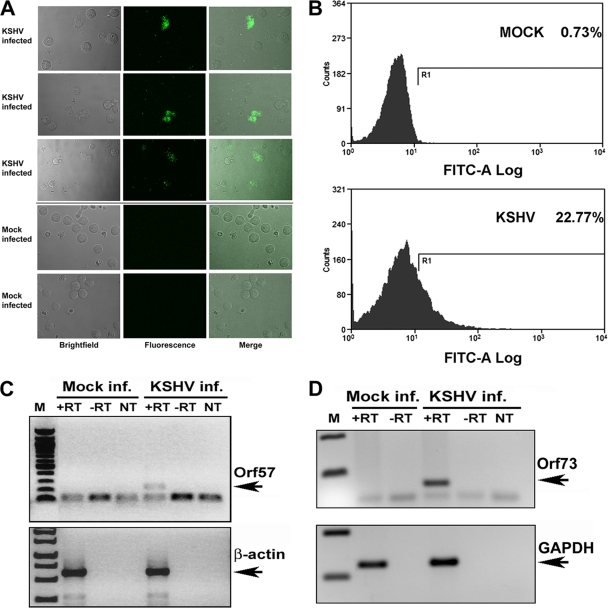
FIG. 5.
KSHV infection of pDCs. (A) Mock- or KSHV-infected live pDCs were imaged using confocal microscopy to identify KSHV-infected cells. Cells expressing GFP were detected only in KSHV-infected pDCs, whereas no GFP was detected in the mock-infected cells. Images were taken on a Zeiss LSM5 Pa laser scanning microscope and processed using the Zeiss LSM Image browser. (B) Percent GFP expression in mock-infected pDCs versus KSHV-infected pDCs at 16 h postinfection. Flow cytometry of mock- and KSHV-infected cells. (C) Orf57 transcription in KSHV-infected pDCs. Cell pellets were processed for RNA and reverse transcribed to cDNA. RT-PCR was performed using primers for the viral early lytic gene Orf57. KSHV Orf57 transcription was detected only in KSHV-infected cells, not in mock-infected cells. Controls included RT-PCR of β-actin transcript levels. +RT, reverse transcription of the isolated RNA; −RT, isolated RNA was added to the RT-PCR mix to serve as a control for genomic DNA contamination; NT, no template was added to the RT-PCR mix to serve as a negative control for the primer sets. (D) Orf73 transcription in KSHV-infected pDCs. Analysis was performed as described for panel B. Controls included RT-PCR of GAPDH transcript levels.

