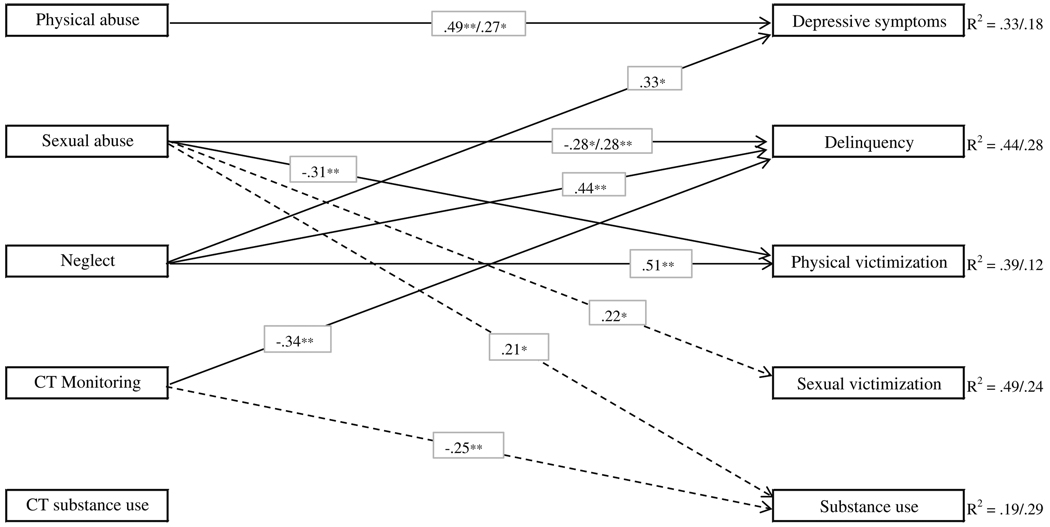
Fig. 1.
Standardized path coefficients for foster care (n = 110) and non-foster care youth (n = 62). Note: ** p < .01, * p < .05. CT refers to caretaker. The paths for foster care respondents are represented by solid lines; the paths for non-foster care respondents are signified by dashed lines. When two coefficients are provided, the coefficient for foster care is listed first

