
Figure 3. Results of comparisons between humans and each ape species.
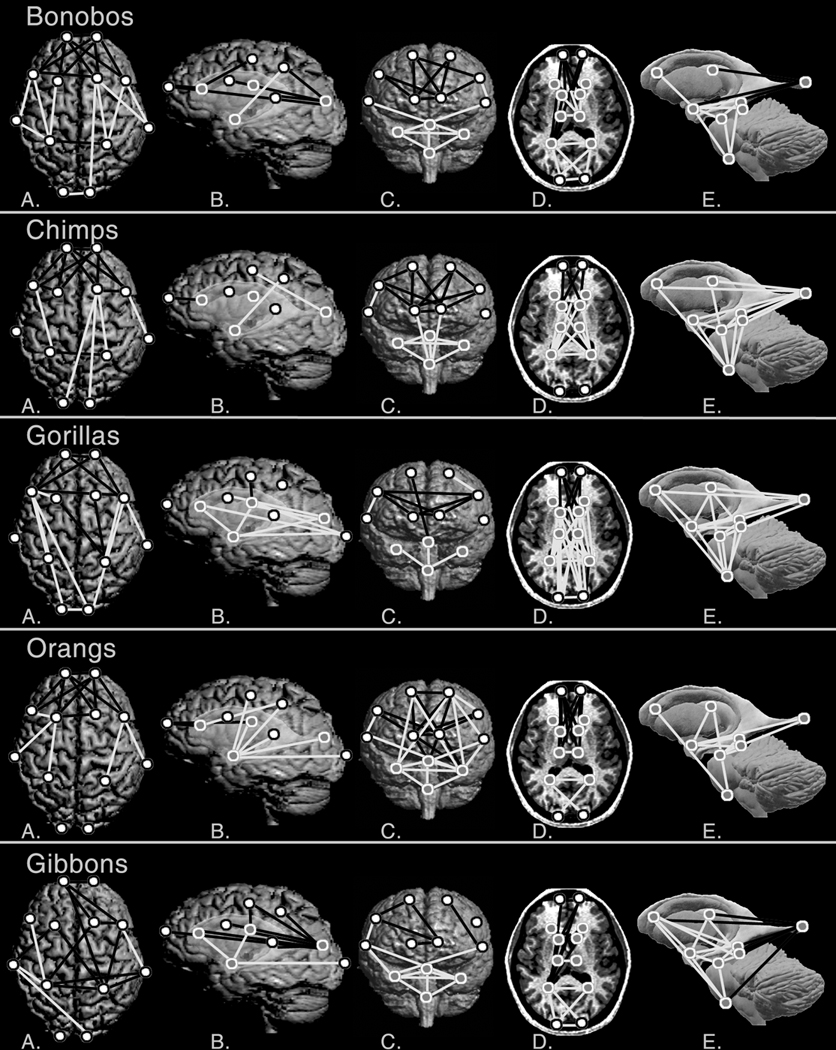
A) superior cerebral surface; B) left lateral surface with ghosted subcortical structures; C) anterior surface; D) axial slice; and E) a model of subcortical structures. Landmarks are defined in Table 2. Symbols and line colors are as in Figure 2.