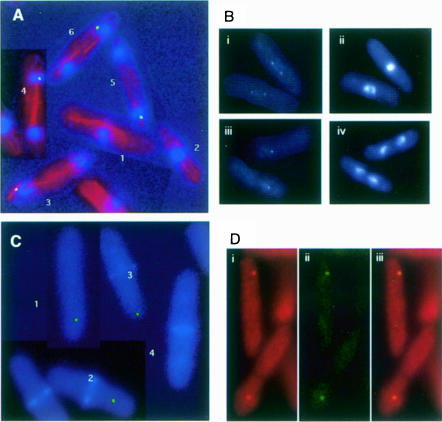
Fig. 2. Localization of GFP–Sid1p. (A) Cells expressing GFP–Sid1p (green) were processed for immunofluorescence and stained for tubulin (red) and DNA (blue). Numbers indicate cells at stages of the cell cycle described in the text. (B) GFP–Sid1p cells in early (i and ii) and late (iii and iv) anaphase were fixed and stained for DNA. Panels i and iii show GFP–Sid1p fluorescence, and the corresponding DNA fluorescence is displayed in panels ii and iv. (C) Cells were fixed and stained for septum material (blue) with calcofluor. (D) Cells expressing Cdc7p-HA and GFP–Sid1p were fixed and processed for immunofluorescence using HA antibodies. Cdc7-HA fluorescence (i) and GFP–Sid1p fluorescence (ii) were merged (iii) to show co-localization of the two proteins.

An official website of the United States government
Here's how you know
Official websites use .gov
A
.gov website belongs to an official
government organization in the United States.
Secure .gov websites use HTTPS
A lock (
) or https:// means you've safely
connected to the .gov website. Share sensitive
information only on official, secure websites.
