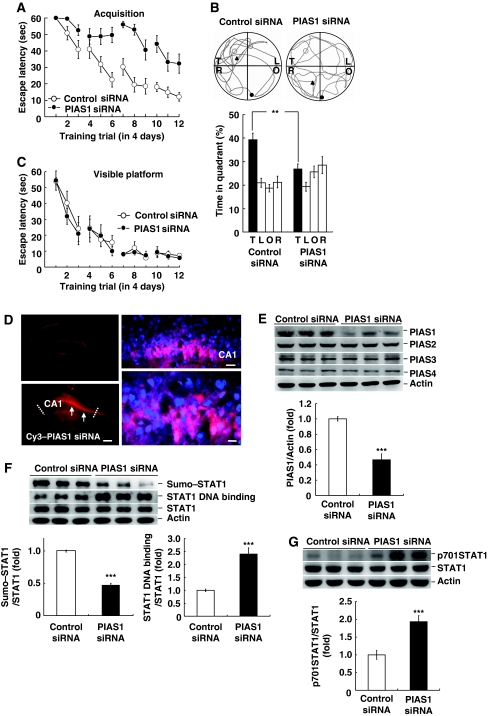
Figure 3.
Transfection of PIAS1 siRNA impairs spatial learning, decreases STAT1 sumoylation, increases STAT1 DNA binding and increases STAT1 phosphorylation at Tyr-701. PIAS1 siRNA or control siRNA was transfected to CA1 area and rats were subjected to (A) water-maze learning and (B) probe trial test. (C) The same transfection was made to different groups of rats and they were subjected to visible platform learning. (D) Immunohistochemical staining against Cy3 and DAPI showing PIAS1 siRNA transfection to CA1 area at different magnifications. A control image (control siRNA without Cy3) is shown in the upper left panel and Cy3 image is shown in the lower left panel. The dotted lines indicate the CA1 area and arrows indicate the area of transfection. Scale bar=360 μm (lower left panel). Cells show both red fluorescence (Cy3) and blue fluorescence (DAPI) are cells successfully transfected with PIAS1 siRNA (right panels). Scale bar=40 μm for upper right panel and scale bar=10 μm for lower right panel. (E) Representative gel pattern for protein levels of PIAS1, PIAS2, PIAS3, PIAS4 and the statistics for PIAS1 expression after PIAS1 siRNA transfection to CA1 area and probe trial test. (F) Representative gel pattern and statistics for STAT1 sumoylation and STAT1 DNA binding after PIAS1 siRNA transfection to CA1 area and probe trial test. (G) Representative gel pattern and statistics for STAT1 phosphorylation at Tyr-701 after PIAS1 siRNA transfection to CA1 area and probe trial test. N=9 each group. Data are expressed as in Figure 2. **P<0.01 and ***P<0.001 from Student's t-test.

