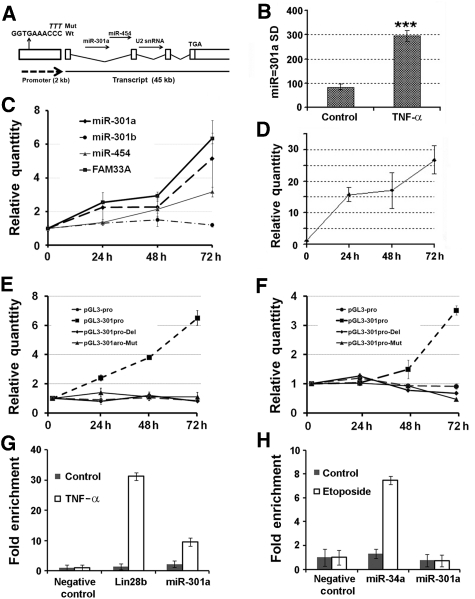
Figure 3.
NF-κB activation promotes miR-301a expression. (A) The gene structure of miR-301a/FAM33A. The sequence ‘GGTGAAACCC' is a predicted p50-RelA-binding site in the miR-301a promoter (301aPro) and the upper italic letters ‘TTT' replaces ‘CCC' in the miR-301a promoter mutation construct (301aPro-Mut). (B) miR-301a up-regulation in a microarray assay for 293T cells treated with TNF-α. The y axis denotes the relative signal density (SD) for miR-301a. ***P⩽0.0001 with n=7. (C) Expression of the transcriptional unit of miR-301a and FAM33A in 293NF-κB cell lines with TNF-α treatment. ‘Relative Quantity' in (C) is the relative expression level of genes determined by qPCR when referenced by that of β-actin or U6 snRNA. (D) Luciferase reporter assays with TNF-α treatment in 293NF-κB cell line. TNF-α induced NF-κB activity in a time-dependent manner. (E) The promoter of miR-301a (pGL3-301aPro) was active and responsive to TNF-α treatment in 293T cells. The mutant (pGL3-301aPro-Mut and pGL-301aPro-Del) and pGL3-pro (SV40-promoter) were active, but unresponsive to TNF-α. (F) Similar to (E), but in PANC-1 cells. ‘Relative Quantity' in (D–F) is the ratio of the firefly luciferase activity driven by various promoters normalized to that of Renilla luciferase from a co-transfected construct (pRL-TK) before referenced to that from cells without TNF-α stimulation. (G) NF-κB (RelA) occupancy (fold enrichment) at the miR-301a locus. ChIP assays were performed on lysates prepared from 293T cells with or without TNF-α treatment using antibodies against RelA. (H) p53 occupancy assay. Similar assay was performed as in (G), but with p53 antibodies and etoposide treatment. ‘Fold enrichment' in (G) and (H) was represented by two to the power of Ct (input) subtracted by Ct (elute) before normalized to that of the negative control. Error bars represent s.d.

