Figure 5.
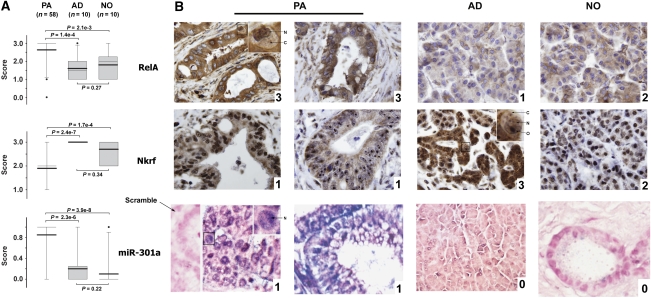
Decreased Nkrf expression in pancreatic adenocarcinomas (PA). (A) Expression levels of Nkrf, RelA, and miR-301a in PA, adjacent non-cancerous tissues (AD), and normal pancreas tissues (NO). Whisker-box plot with the boxes indicate 25th and 75th percentile; thin lines in the boxes indicate 50th percentile and thick lines denote the mean values (50th percentile and mean value for Nkrf overlap); Whisker caps indicate 5th and 95th percentile; filled circles indicate outliers. P-values of two-tailed Student's t-test are provided. (B) Representative photos taken at × 20 magnification. Arrows point to cytoplasm (C), nucleoplasm (N), and nucleolus (O). A scrambled probe for miR-301a was used as a negative control that did not stain any tissue sections (one image shown in the leftmost). PA, pancreatic adenocarcinomas; AD, adjacent non-cancerous tissues; and NO, normal pancreas tissues. Numbers on the right-bottom corner of each panel denote histological scores.

