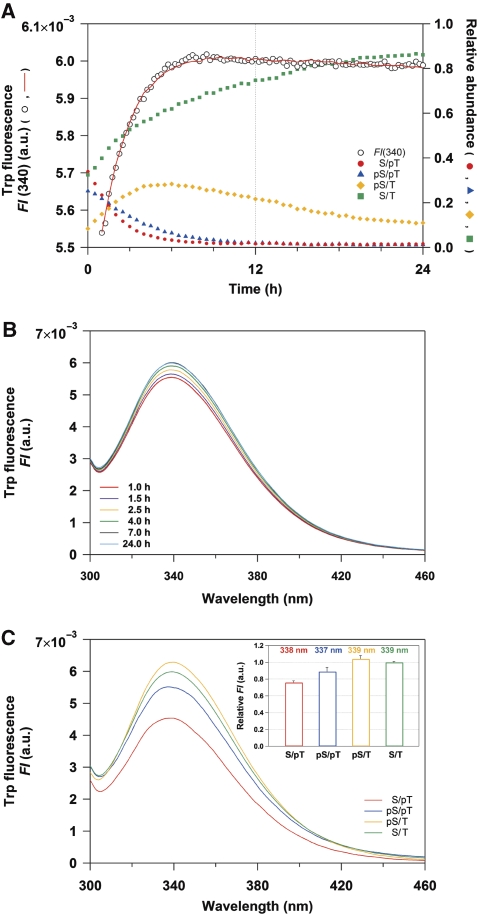
Figure 1.
Tracking the KaiC auto-dephosphorylation reaction of KaiC-WT using time-resolved fluorescence spectroscopy. (A) Time course of Trp fluorescence (open circles) at 340 nm compared with the relative abundance of KaiC-WTS/pT (red circles), KaiC-WTpS/pT (blue triangles), KaiC-WTpS/T (orange diamonds), and KaiC-WTS/T (green squares). The red line represents a global fit of Equation (1) to FI(340) using pre-determined concentration profiles of the four phosphorylation states (see Materials and methods). (B) Time-resolved fluorescence spectra of Trp excited at 295 nm for KaiC-WT. For clarity, only 6 of the 93 time points are displayed. (C) Trp fluorescence spectra deconvoluted into four phosphorylation states of KaiC-WT. The inset shows emission maxima and relative FI of the deconvoluted spectra. See also Supplementary Figure S3.

