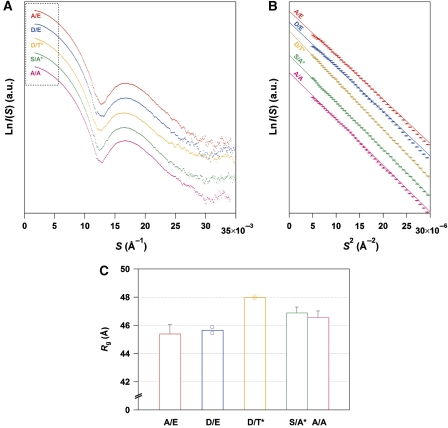
Figure 3.
SAXS curves of phospho-mimicking KaiC mutants. (A) Comparisons among entire SAXS curves at infinite dilution. Natural logarithm of scattering intensity (LnI(S)) is plotted against scattering angular momentum (S). The plots from top to bottom represent the SAXS curves of KaiCA/E (red), KaiCD/E (blue), KaiCD/T* (orange), KaiCS/A* (green), and KaiCA/A (magenta), respectively. Each plot is longitudinally shifted for clarity of presentation. The region surrounded by the dotted box is expanded as a Guinier plot in Figure 3B. (B) Comparisons among Guinier plots at infinite dilution. Natural logarithm of scattering intensity (LnI(S)) is plotted against squared scattering angular momentum (S2). Each thin line shows the linear fit to LnI(S) using the S range from 0.0022 Å to Smax <1.3/2πRg. The slope for KaiCD/T* is much steeper than those for other KaiC mutants, demonstrating a less compact conformation with a larger Rg. (C) Radius of gyration (Rg) of phospho-mimicking KaiC mutants at infinite dilution. KaiCD/T* and KaiCS/A* mutants were incubated for 4 h at 30°C to mimic KaiC-WTpS/T and KaiC-WTS/T, respectively (Nishiwaki et al, 2007). For KaiCD/E and KaiCD/T* mutants, results from two independent measurements are plotted as open circles together with their mean as bars. For other mutants, results are presented as mean±s.d. from three or more independent experiments. See also Supplementary Figure S2 and Supplementary Table S1.

