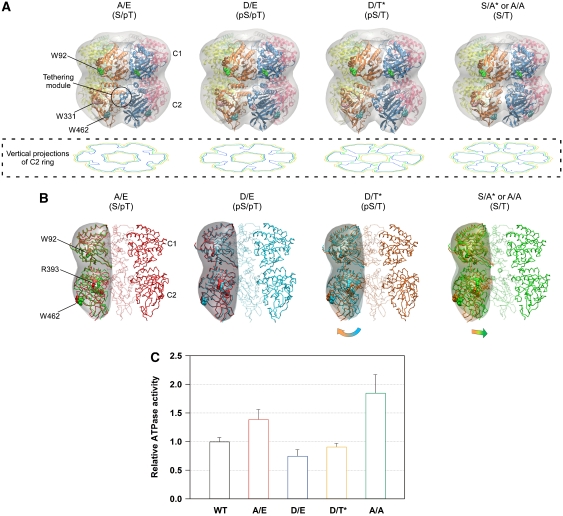
Figure 4.
Expanding and contracting motions of the C2-ring coupled to the ATPase activity of KaiC. (A) Low-resolution models of the KaiC hexamer. The protomer–protomer arrangement of the known X-ray crystal structure of KaiC was refined against the SAXS data under the assumption of P6 symmetry (see also Supplementary Figure S4). Smooth envelopes were calculated at 25 Å resolution to visualize molecular shapes using the SITUS software package (Wriggers and Chacon, 2001). Residues displayed as space-filling models indicate the approximate positions of three Trp residues, W92 (green), W331 (pink), and W462 (cyan). The potential tethering module is highlighted by a circle. The contour image below each model is the vertical projection (voxel spacing of 5 Å) of the C2 ring (low: orange, medium: green, high: blue). (B) Cross-sectional view of the KaiC models along the P6 symmetric axis. Panels from left to right correspond to KaiCS/pT (red), KaiCpS/pT (cyan), KaiCpS/T (orange), and KaiCS/T (green). To visualize the changes in the domain orientation, one protomer of the former phosphorylation state is superimposed upon one protomer of each model using the C1 ring. Smooth envelopes at a 25 Å resolution were drawn only for the compared protomers. Residues displayed as space-filling models point to approximate positions of W92, W462, and R393 in KaiC. (C) ATPase activity of phospho-mimicking KaiC mutants. The rates of ATP hydrolysis are plotted as relative to that of KaiC-WT at 30°C. As KaiC-WT includes four different phosphorylation states during the assay (e.g. Figure 1A), its ATPase activity set to unity is intermediate between the lowest KaiCD/E activity (0.75±0.11) and the highest KaiCA/A activity (1.85±0.32). Data for KaiCA/A and KaiCD/E are taken from Terauchi et al (2007). The results are presented as mean±s.d. from five or more independent experiments.

