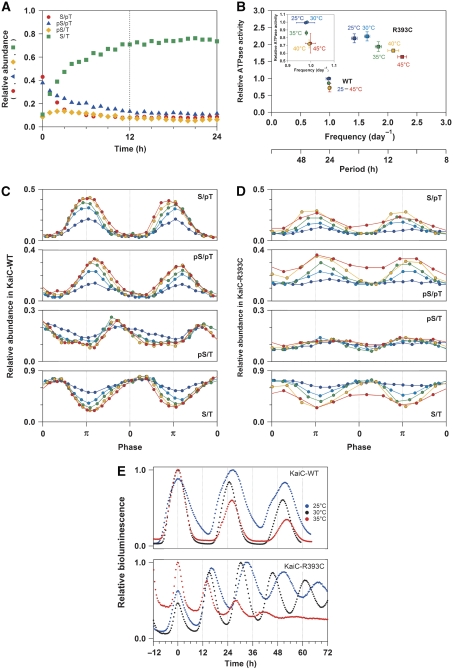
Figure 5.
Modulation of the temperature-compensation mechanism in KaiC-R393C. (A) Relative abundance of KaiC-R393CS/pT (red circles), KaiC-R393CpS/pT (blue triangles), KaiC-R393CpS/T (orange diamonds), and KaiC-R393CS/T (green squares) during the auto-dephosphorylation reaction. (B) Temperature dependence of the relationship between the ATPase activity of KaiC alone (in the absence of KaiA and KaiB) and period/frequency of in vitro phosphorylation cycle. The ATPase activities of KaiC-WT (circles) and KaiC-R393C (squares) at 25°C (blue), 30°C (cyan), 35°C (green), 40°C (orange), and 45°C (red) were plotted relative to that of KaiC-WT at 30°C. The inset depicts the expanded view for KaiC-WT. (C, D) Relative abundance of KaiC-WT and KaiC-R393C, respectively, during the phosphorylation cycle at 25°C (blue), 30°C (cyan), 35°C (green), 40°C (orange), and 45°C (red). The curves were plotted as a function of phase angle. The phase angle of π corresponds to peaks of KaiC-WTS/pT or KaiC-R393CS/pT (see also Supplementary Figure S5). (E) Bioluminescence rhythms of KaiC-WT and KaiC-R393C at 25°C (blue), 30°C (black), and 35°C (red). For clarity of comparison of the temperature dependency of the period, each bioluminescence rhythm is shifted horizontally so that the first peak matches 0 h.

