Figure 6.
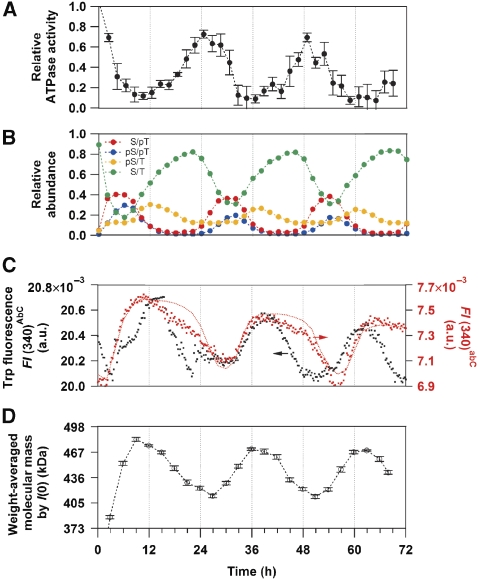
Circadian ticking of KaiC in relation to the temporal patterns of ATPase activity, phosphorylation, and assembly/disassembly in the presence of KaiA, KaiB, and KaiC at 30°C. (A) Relative ATPase activity of KaiC. (B) Relative abundance of the phosphorylated/dephosphorylated states of KaiC. (C) Trp fluorescence intensities at 340 nm using KaiA-WT (FI(340)AbC, black circles) or KaiA-W10F mutant (FI(340)abC, red circles). Given that the Trp fluorescence from all molecules of KaiA-WT remained unchanged during the cycle, their contribution to FI(340)AbC in Figure 6C is calculated to be about 14.7 × 10⁻³. The red dotted line represents a result simulated by using Equation (1), Ai(t) upon coincubation of KaiA-W10F with KaiB and KaiC-WT, and the deconvoluted FI(340) shown in Figure 1C (plotted with a slight baseline offset; FI(t,340)−3.59 × 10⁻⁶ t+1.64 × 10⁻³). (D) Weight-averaged molecular mass estimated from forward scattering intensity, I(0), taken from Akiyama et al (2008).

