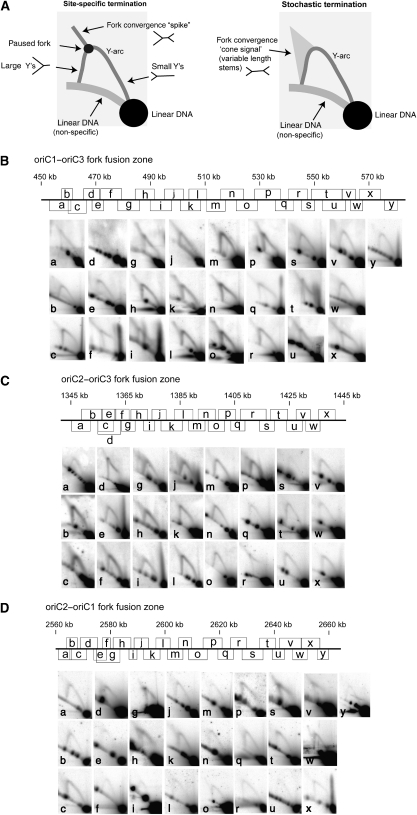
Figure 1.
2D gel electrophoresis analysis of the fork fusion zones of S. solfataricus P2. (A) Cartoons depicting the possible outcomes of 2D gel analysis with respect to different mechanisms of replication termination. (B) oriC1–oriC3 fork fusion zone. (C) oriC2–oriC3 fork fusion zone. (D) oriC2–oriC1 fork fusion zone. The scale map in each panel indicates the genomic location of the restriction fragments and corresponding 2D gel results in the panels below. For each 2D gel, DNA from mid-log phase cells was digested with an appropriate restriction enzyme and then subjected to 2D agarose gel electrophoresis. The 2D pattern for each particular restriction fragment was then obtained by Southern hybridization. The coordinates for the fragments and probes are given in Supplementary Table S1, available at The EMBO Journal Online.

