Figure 2.
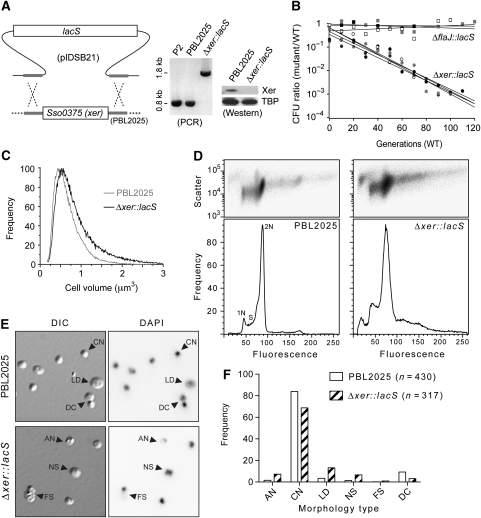
Deletion of xer and phenotypic effects on S. solfataricus. (A) Double-crossover recombination of linearized pIDSB21 with the PBL2025 chromosome results in the exchange of lacS for xer, which was confirmed by PCR using primers designed from the flanking regions, and western blotting using anti-Xer antibodies. The blots were then probed with anti-TATA box binding protein (TBP) as a loading control. (B) Growth competition between ΔflaJ::lacS (squares) or Δxer::lacS (circles) and the parent PBL2025 (WT) strain. Results from three independent experiments for ΔflaJ::lacS versus PBL2025 and four independent experiments for Δxer::lacS versus PBL2025 are shown. (C) Coulter cell volume analysis of mid-log phase PBL2025 and Δxer::lacS populations. Data were normalized to their highest values. (D) Flow cytometry analysis of cellular DNA content for PBL2025 and Δxer::lacS. Side-scatter 2D plots (upper panels) and fluorescence histograms (lower panels) are shown. (E) Representative light micrographs showing differential interference contrast (DIC) and fluorescence (DAPI) images acquired for the same field of cells from the indicated strains. Examples of the types of cells observed are indicated by arrowheads. AN, anucleate; CN, compact nucleoid; LD, large diffuse nucleoid; NS, nucleoid segregation; FS, failed segregation; DC, doublet or dividing cell. Further examples are provided in Supplementary Figure S2, available at The EMBO Journal Online. (F) Frequency analysis of the morphology types observed by microscopy. Each cell type was scored as percent of total cells.

