Figure 4.
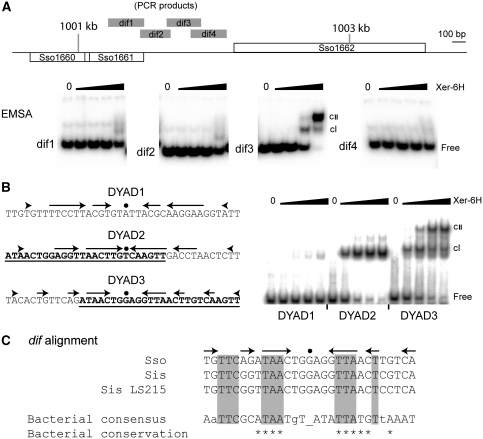
In vitro identification of the dif site. (A) EMSA analysis of the four PCR fragments indicated by grey bars in the map of the SSO1161–1162 region. Each reaction contained 5 nM labelled PCR product and 0, 8, 40, 200 or 1000 nM Xer-6H (by monomer, left to right, in each panel). (B) Sequences of the three dyads analysed from the dif3 PCR fragment. Arrows represent DNA sequence symmetry around the central dot. The underlined and bold sequences of DYAD2 and DYAD3 indicate their region of overlap. Double-stranded oligonucleotides of these sequences were end labelled and then used in EMSA reactions at 2 nM with 0, 19, 55, 167 or 500 nM Xer-6H, left to right in each case. cI and cII indicate the respective mobility-shifted complexes. (C) Alignment of the dif sequence (DYAD3) from S. solfataricus (Sso) with sites identified by similarity searching in closely related Sulfolobus islandicus (Sis; strain L.S.2.15 contains a single change compared with other sequenced strains), and the proteobacterial consensus sequence (Carnoy and Roten, 2009). Shading indicates sequence matching. Asterisks indicate positions with >90% conservation in proteobacteria, whereas positions with <50% conservation are shown as lower case letters.

