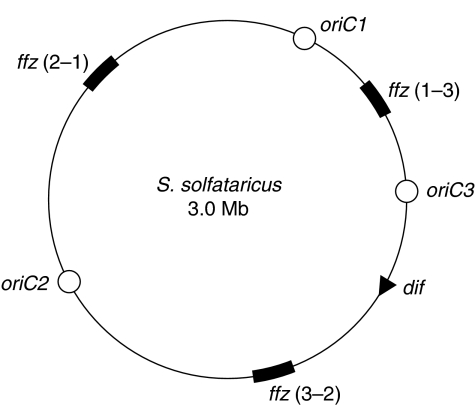
Figure 6.
Overall replication organization of the S. solfataricus chromosome. Origins are indicated with open circles, the ∼100-kb fork fusion zones [ffz(x−y), where x and y refer to adjacent origins] tested in Figure 1 are shown as thick black arcs and the dif site by a black triangle.

