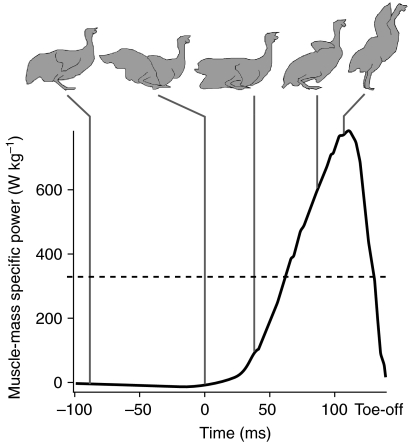
Fig. 4.
Profiles of amplified power. Muscle-mass specific power output in a jumping guinea fowl. The power developed during a jump shows an asymmetric profile with peak power occurring late in the jump. In addition, the power achieved during the jump exceeds the estimated peak power output of the hindlimb muscles (dotted line) by more than a factor of two. Taken together, the patterns observed in this jump are consistent with the use of elastic mechanisms to amplify power output (modified from Henry et al., 2005).

