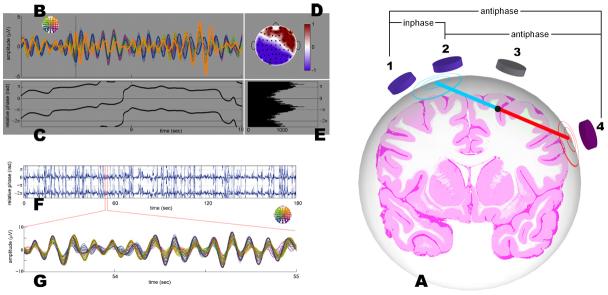
Fig. 3.
Single source contributions to inter-electrode coherence. (A) Tangential patterns arising from a source in a sulcal wall contribute both to spurious antiphase and inphase synchronization. The electrodes situated above the source are typically silent (electrode 3), but electrodes located further away unmask the source's activity (electrodes 1, 2, 4). In step with solid angle theory, the points of maximal amplitudes are found where the vector normal to the active cortical patch (blue and red lines) meets the surface of the scalp (blue and red concentric circles). Antiphase coupling will be found between electrode pairs 1-4 and 2-4; inphase coordination between electrode pair 1-2. Task-dependent recruitment of this brain area is sufficient to obtain a robust change in inter-electrode coherence (see example B-E). The same holds true for the recruitment of a gyral area (inphase pattern, see F-G). In both cases, changes in coherence are due to local processing rather than to large-scale coordination. (B) Shows a 2-s sample of EEG filtered around 11 Hz, recorded when a subject voluntarily interrupts continuous right finger movements. Electrodes are color-coded according to the map presented in the insert. Electrodes F8 (orange) and O1 (blue) are emphasized (bold lines). Antiphase-locking occurs during two episodes as seen in the time course of the relative phase (C) and its cumulative distribution (E). A topographical map at time 8.4 s (D) reveals the spatial characteristics of the pattern. Similarly, (F-G) shows spurious episodes of inphase-locking in the alpha (10 Hz) range. In (F), the relative phase between electrodes Pz and FCz during 3-min of eyes-closed EEG shows massive preference for inphase-locking. These electrodes are typically located 10 cm apart. In (G), band-pass filtered signals of a 60-channel electrode array are displayed for a small period of time from 53.5 to 55 s. Electrode Pz (purple) and FCz (brown) are emphasized (bold lines). They exhibit two episodes of phase-locking inphase from 53.5 to 53.75 s and from 54.3 to 55 s.

