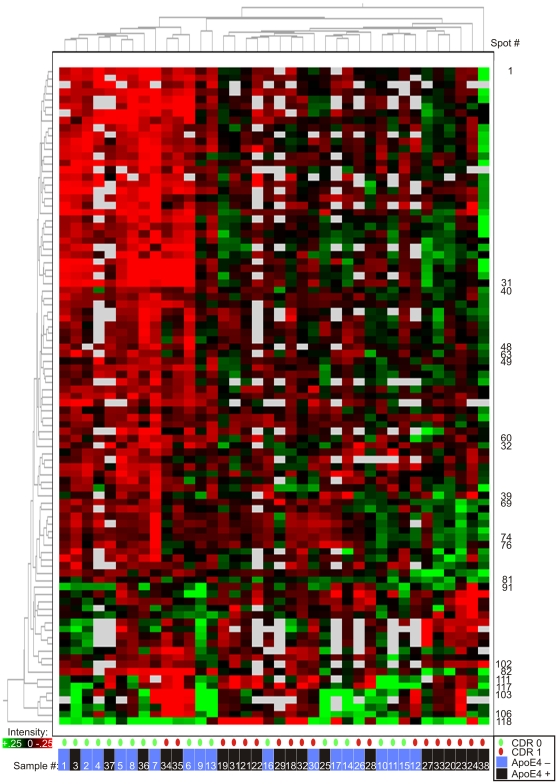
Figure 3. Unsupervised clustering of CSF samples by 2D-DIGE data, excluding gel features containing apoE protein.
All other statistically significant gel features (Student's t-test α = 0.05, present in >50% of images) are retained. As in Figure 2, five gels containing hemoglobin (n = 10 samples) were excluded. Columns represent samples, numbered according to their original positions in Figure 2. Rows represent gel features, numbered as in Figure 2; unlabeled rows are in consecutive order from upper number to lower number, with interruptions in sequence indicated by labels. ApoE-containing features are removed. Gel feature intensity is encoded colorimetrically from red (low intensity) to green (high intensity); white indicates absent data. CDR status of participants at time of CSF collection is encoded below, by small green (CDR 0) and red (CDR 1) ovals. APOE-ε4 status (as described for Figure 2) is indicated by blue (ApoE4 negative) or black (ApoE4 positive) bars, below. Clustering pattern of samples (numbered consecutively in order of appearance in Figure 2, from left to right) relative to Figure 2 is indicated by white numerals, below.

