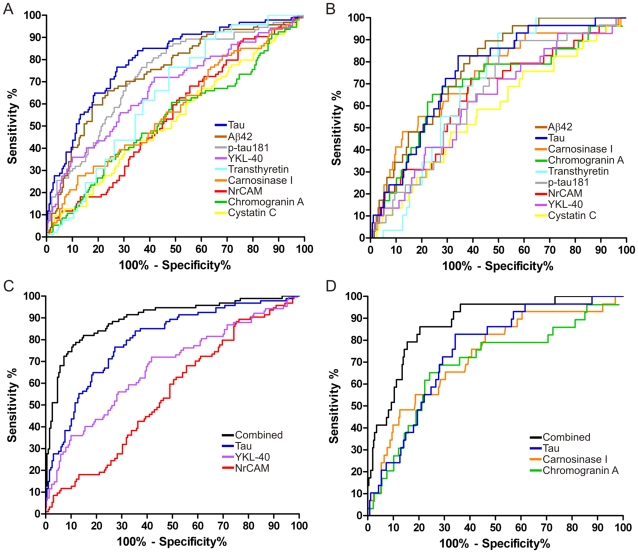
Figure 6. Receiver Operating Characteristic (ROC) curves of ELISA data from ‘validation’ cohort.
Simple ROC analyses were performed for each biomarker to distinguish A. CDR>0 from CDR 0 (“earlier diagnosis”) and B. CDR 1 from CDR<1 (“early diagnosis”). Stepwise logistic regression models were used to identify combinations of these biomarkers that would distinguish C. CDR>0 from CDR 0 (“earlier diagnosis”), AUC = 0.90 and D. CDR 1 from CDR<1 (“early diagnosis”), AUC = 0.88.

